

With the Universal Analytics (standard) data collection deadline well in the rearview mirror and the Universal Analytics 360 deadline not far off, it is past time you ensure you are prepared to get the most out of Google Analytics 4 (GA4).
The data model is not the same. The collection methods are not the same, and the reporting interface and standard reports are definitely not the same. All in all, we are talking about some major (and some rather minor) differences between Universal Analytics and Google Analytics 4 (GA4).
If you are still confused about where to go for what information, you are not alone. In this post, we’ll break down some of the essentials of actionable data in the context of Google Analytics 4, but it’s not always clear that the confusion around Google Analytics 4 is as platform-specific as many people let on.
The long-standing familiarity many marketers and analysts felt in the Universal Analytics reporting interface (and associated reporting and visualization tools they used with Universal Analytics) does show how resourceful people learned over time how to access the data and reporting they wanted out of Universal Analytics.
Familiarity with retrieving information should not be confused with generating actionable insights and building a framework for data-informed decision making and automation.
And that’s a good news, bad news scenario if ever there was one. The bad news is that neither Google Analytics 4 nor Universal Analytics were providing much value if you weren’t and aren’t using them to generate actionable insights and taking advantage of the integrations and interoperability with the rest of the GMP stack (as well as some third-party platforms).
The good news is that Google Analytics 4 is now a relatively fully-baked platform, and it offers some powerful measurement and integration capabilities that can be a core tool in your marketing toolbox going forward (notice I didn’t say something silly like ‘single source of truth’).
Generating Actionable Insights From Your GA4 Account

How do really good analysts generate meaningful insights from their data? How do they present it in a way that makes it actionable? How do they put it into a narrative that makes it impactful and intuitive for stakeholders?
These fundamentals haven’t changed in the shift to Google Analytics 4.
Here are a few tips to help drive great analysis:
- Start with specific business questions you are trying to answer.
- If you want your insights to be actionable, focus on answering business questions that have natural follow-up activities associated (e.g. what are the most popular site search terms that have no purchase actions associated)?
- Align your analysis to actions you want to take on the marketing side of the business
- target/suppress audiences in media platforms
- Maximize RFM metrics
- Model propensity scores against some desired action/outcome and then create audience segments (deciles, quintiles, etc.)
- Do a little bit of unstructured data exploration as a regular part of your analysis work: find interesting and/or anomalous data related to content performance, campaigns, conversion paths, audience segments, or any other dimension of interest. Create a list of items that stand out to you as interesting, and then formulate more specific, structured inquiries to produce formal analysis & insights work.

Where to go for what data in Google Analytics 4
Depending on your perspective, Google Analytics 4 has either changed a lot or a little in terms of where you go for data and what you do with it when you get there.
I’m going to start at the top and go through a variety of standard reports in the Google Analytics 4 user interface because those are likely to be the biggest ongoing source of confusion and misinformation if people take the path of least resistance to the information, especially if it turns out to be the wrong information.
For example, everyone keeps saying that Google Analytics 4 ‘uses data-driven attribution by default’. It’s true as long as you haven’t adjusted that setting to last click in the attribution settings for your property. But that doesn’t mean that all reports in GA4 use data-driven attribution (DDA) by default! GA4 in-platform reporting wouldn’t even make sense if it did, so let’s start with reports that make use of some form of attribution and see why it’s not all a data-driven world. Technically, it’s all driven by data, but several standard reports look a lot more like first-click or last-click attribution rather than algorithmic, multi-touch attribution.
Let’s jump into it.
The Acquisition reporting has two sections in addition to the Overview: User Acquisition and Traffic Acquisition.
User Acquisition reports show you the campaign data (or other channel, source, medium data) that drove a user’s first session in your GA4 property. That data does not change for that user for as long as they are identifiable in GA4 as that user. For good reason, you don’t want that report to use data-driven attribution, and you also do not reference this report for advertising performance data whenever you are trying to report on and analyze multi-touch attribution with fractional conversion credit. This report doesn’t do that. This report shows you what its name so literally implies: how did I acquire my users?
Traffic Acquisition reports are equally literal, and I am guessing you are already a step ahead of me. These reports show you how your sessions were generated irrespective of how you originally acquired a user.
Example journey of a single user with five sessions recorded in GA4
| first_session | session 2 | session 3 | session 4 | session 5 | |
| Channel | Paid Search | Affiliate | Paid Social | Organic Search | SMS |
| Interactions | Visits websiteVisits PDP | Visits WebsiteBrowses Sale Products | Visits WebsiteRegisters Email/SMSLogs In | Visits WebsiteLogged In | Purchase Conversion |
This fictitious example of a single user with five sessions tracked in GA4 culminating in a purchase provides an illustration of how User Acquisition and Traffic Acquisition reporting works and will be a useful segue into reporting that actually uses data-driven attribution as well.
In this example, the user’s first_session channel is (and always will) attributed to Paid Search because that is the channel grouping that Google has classified the user’s first_session campaign data under. Now, you could create a custom channel definition and reclassify that to a different channel grouping; however, the actual underlying source, medium, and campaign data will not change for that user.
That user has five sessions, each with an associated different channel. In the Traffic Acquisition report, each of those sessions will be reported in the respective channel that drove that particular session, so if you imagine a report with only that User ID’s data, there would be five reporting rows each with one session counted:
- Paid Search
- Affiliate
- Paid Social
- Organic Search
- SMS
Said differently, we have a user count of 1 with five different sessions and one conversion. Each of the sessions has a channel associated with it. This would not be very interesting on its face. However, when you pull the reports we’ve been discussing, you can see that other behavioral data and channel performance data are reported along with these channel dimensions.
Acquisition > Traffic Acquisition
Acquisition > User Acquisition

The reports look fairly similar at first glance. Keeping in mind that this data was pulled from the Google GA4 demo account and does not have a massive multi-channel paid media program firing behind it, we can still see a few exemplary differences between these two reports.
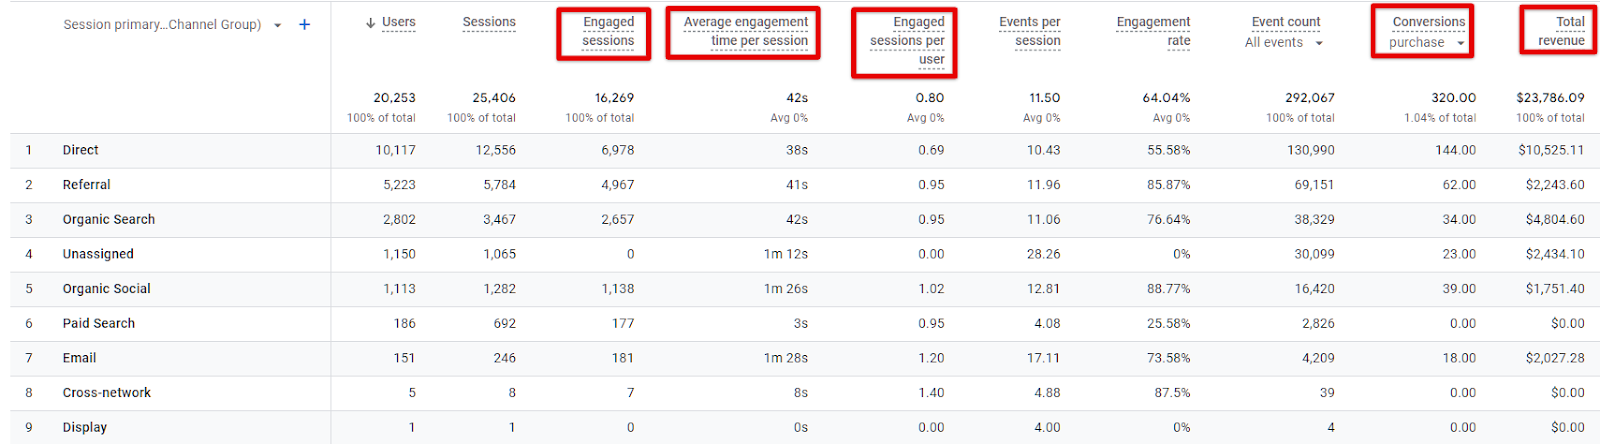
Let’s consider the User Acquisition report first. Keep in mind what the channel dimension represents in each of these reports. The associated metrics follow suit. So, for the time period in question, there was $903.50 in revenue for users that were originally acquired via the Organic Social Channel (Row 4), just as there was $2,634.45 in revenue from users that were first acquired through the Organic Search channel (Row 3). That revenue has nothing to do with how subsequent sessions were generated, including potentially the channel attributed to the session in which the conversion occurred. If this sounds a lot like first-click attribution, it is a lot like first-click attribution.
Now consider the Traffic Acquisition report. All of those metrics are associated with the channel that was recorded for each individual session, so an individual user similar to our example could have several sessions, each with a different marketing channel (and underlying source, medium, and campaign). The metrics associated with each of those individual sessions are included in the respective row associated with the channel for that particular session. Any conversions and other event data are also recorded for that particular session regardless of how that user was first acquired. If this sounds very similar to last-click attribution, it is (similar, not identical).
Forgive the longwindedness, but understanding what is in these reports can help you avoid misconstruing your data and can help point you to the right source of information for a particular set of questions. To understand how you are acquiring users and what those users are doing within a given reporting timeframe, refer to the User Acquisition report. To understand how you are generating sessions (i.e. traffic), go to the Traffic Acquisition report. If you want to get a little crazy and understand how users acquired through paid media channels are driving subsequent sessions and purchases via your customer engagement channels, then use the Traffic Acquisition report but add User Acquisition data as a secondary dimension! In the example below, I have also added a filter to the report to make it easier to see only Users acquired via paid media channels and only revenue generated for sessions driven by my customer engagement channels (email and SMS).
Acquisition > Traffic Acquisition + First user default channel group (secondary dimension)
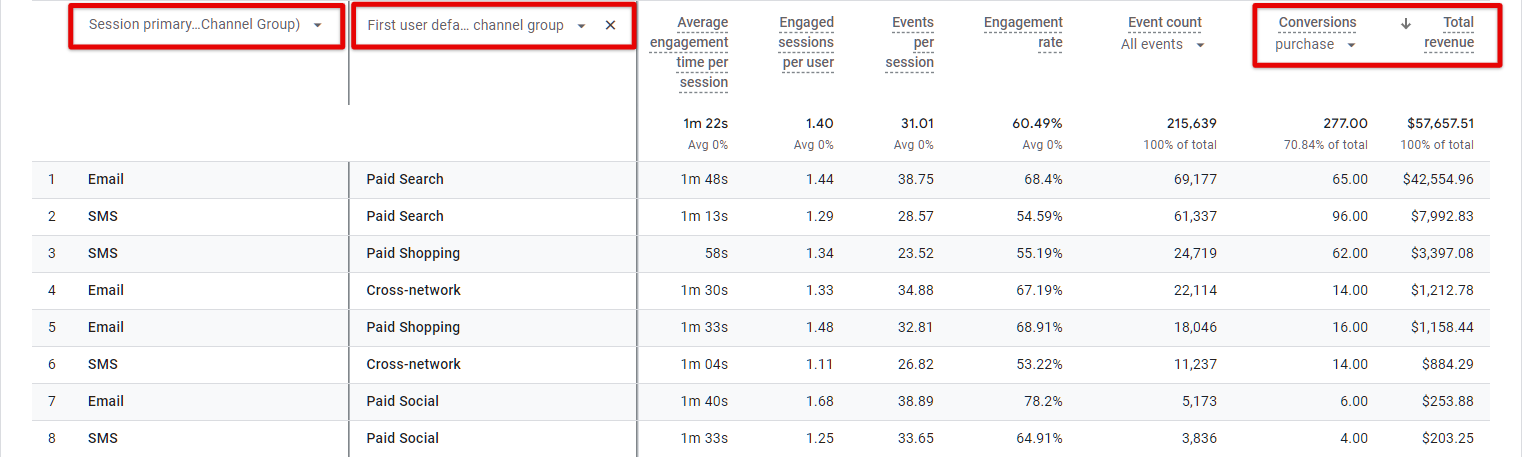
Analysis Tip: You may have noticed that in these reports, I have filtered down to a specific conversion: purchase. It has never made much sense to look at all conversion goals as equal because they often represent widely different user interactions, including everything from form fills, content downloads, and views of key pages to actual revenue-driving purchases. Always hone in on specific data to answer specific questions.
So, where does data-driven attribution by default actually come into the picture? A few different places:
- Advertising Section of Reporting
- Explore reports that use dimensions from the Attribution dropdown (more on this below)
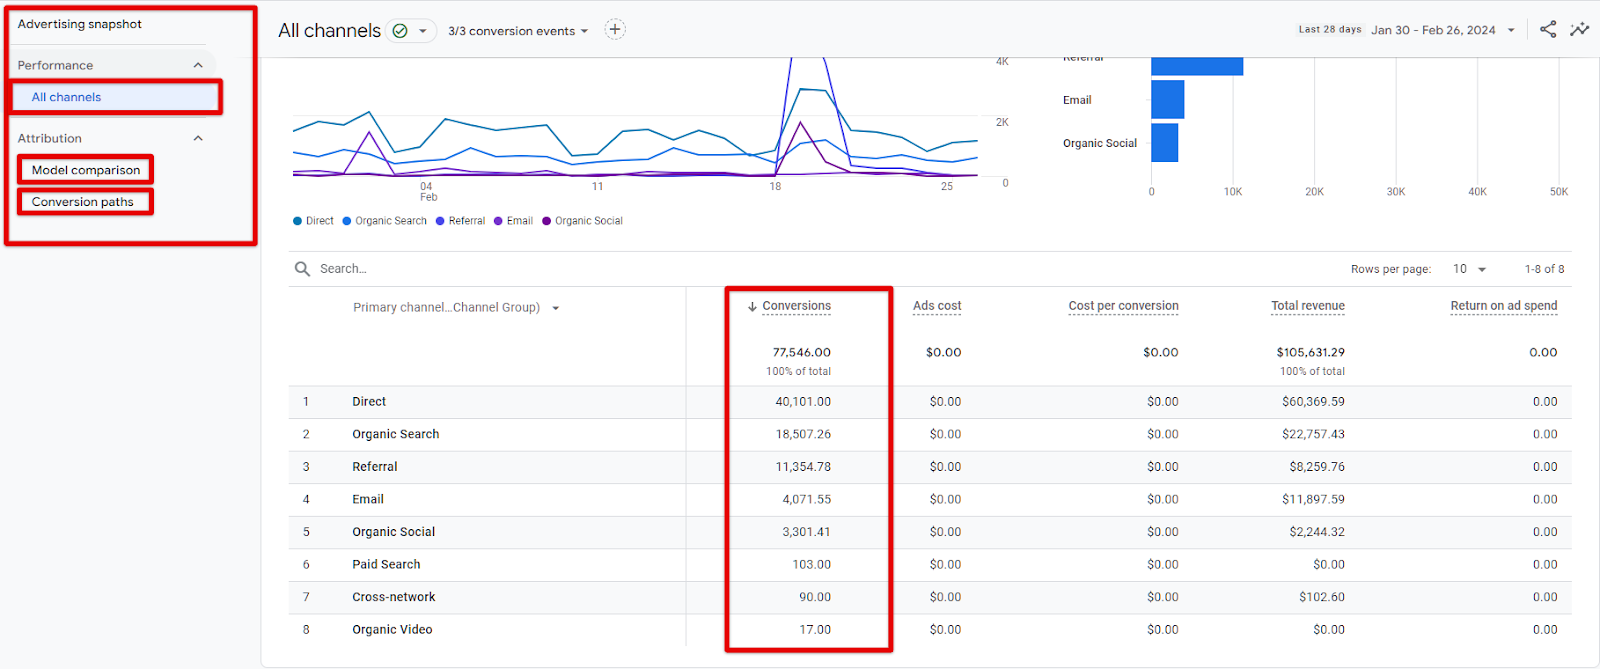
In the Advertising reports (unless you’ve changed the default setting), data-driven attribution applies. Looking at the all channels report below, you’ll start to see fractional conversion credit. For example, Organic Search with credit for 18,507.26 conversions over the past 28 days. This is essentially the sum of all the fractional conversion credit that the channel received for the reporting time period.
Advertising > Performance > All Channels
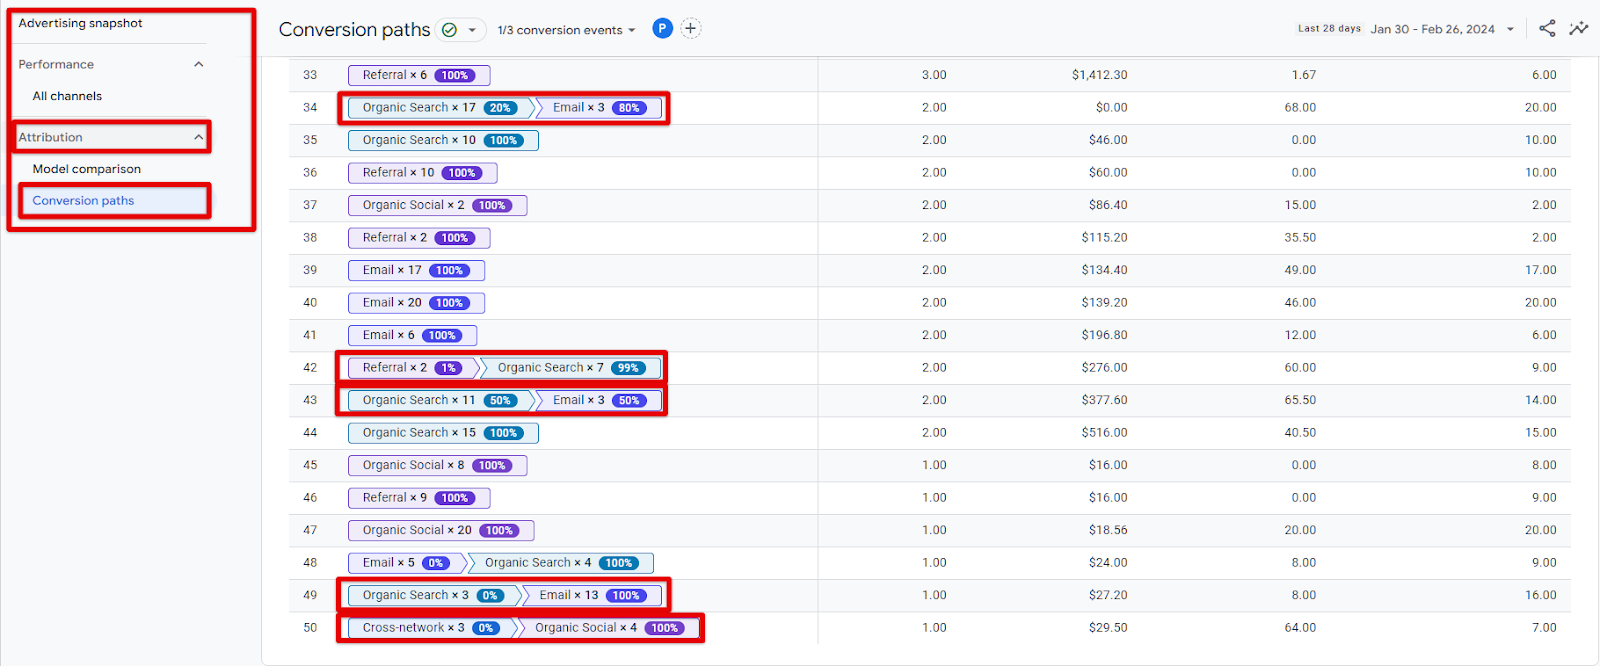
In the path to conversion reporting, you can see both the unique conversion paths and the percentage conversion credit given to the touchpoints visualized. To see the percentage credit attributed in Universal Analytics days, you had to have an Attribution project created for your property.
Advertising > Attribution > Conversion Paths
In the Explore section of Google Analytics 4–aka Google’s ad hoc reporting workbench–DDA is in effect whenever you select reporting dimensions from the Attribution category (see screenshot). Those dimensions include source, medium, campaign, and default channel, as well as specific reporting dimensions for your linked Google Marketing Platform (GMP) accounts (Google Ads, Search Ads 360, Campaign Manager 360, Display & Video 360):
Explore > Add Dimensions > Attribution Dropdown
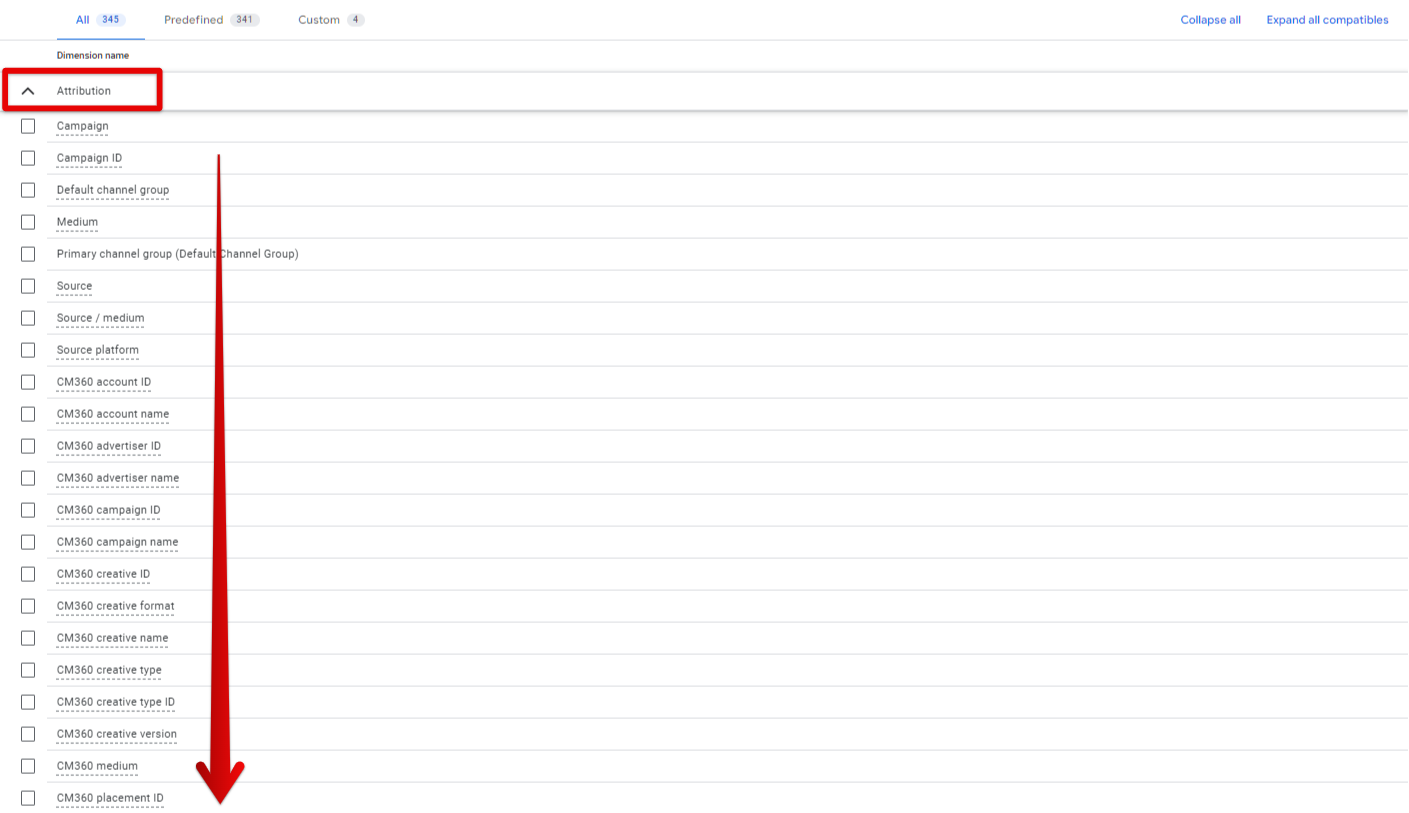
When utilizing these Attribution reporting dimensions to build ad hoc custom reports, not all other dimensions and metrics are compatible with those dimensions. As with other dimensions in Explore, you start to see some dimensions and metrics turn grayed out if they are not compatible with being combined.
With Attribution dimensions selected, you can build ad hoc reports with a surprising level of granularity. For example, combine the default channel group with transaction ID as dimensions and layered in revenue. You can see data-driven attribution in action at the individual purchase level, as I have done in the screenshot below.
Explore > Primary Channel Group + Transaction ID Reporting Revenue
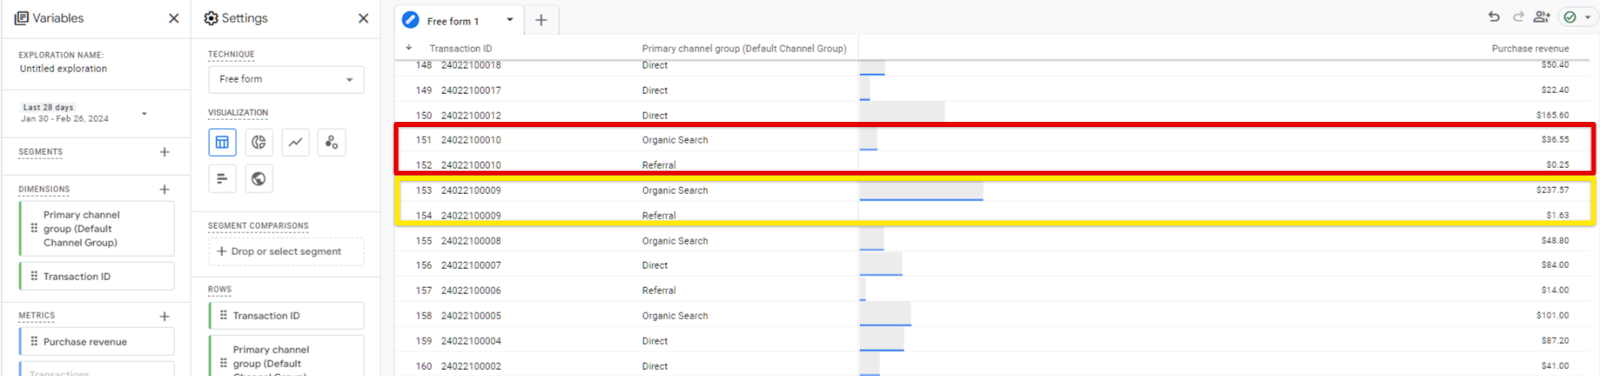
The two sets of transactions highlighted are not reporting bugs. Each transaction ID is repeated, and there is revenue associated with two different channels for each of those transactions. That represents the fractional conversion credit attributed to each of those channels for that single transaction.
When using the Explore area of Google Analytics 4 reporting, you actually have access to all three of the attribution categories we have discussed:
- Dimensions in the Attribution dropdown (data-driven attribution unless you have changed your GA4 property’s attribution configuration)
- Under the Traffic Source dimension dropdown, you find two sets of acquisition dimensions
- Dimensions prefixed with ‘session’ (e.g. ‘session campaign’, ‘session medium’, or ‘session source’
- Dimensions prefixed with ‘first user’ (e.g. ‘First user campaign’, ‘First user medium’, or ‘First user source’)
Dimensions prefixed with ‘session’ follow the logic of the Traffic Acquisition reporting discussed above: paired reporting metrics only include the data for the actual sessions attributed to the channel in question (or campaign, medium, source, etc). Dimensions prefixed with ‘first user’ follow the logic of the User Acquisition reporting discussed above: paired reporting metrics include data during the reporting time period and aggregate it to the campaign data associated with the user’s first session.
Reporting UI Changes Coming!
Google announced this month that there are some significant changes rolling out to the Advertising section of the Google Analytics 4 UI.
The Reports section will remain the primary area to gain insights into how users interact with your website and apps with a focus on experience, behavior, etc.
The Advertising section is intended to become the key area to monitor and report on campaign and channel performance. In light of that, Google is adding Google Ads, Google Marketing Platform, and publisher reporting to the Advertising section. To access the Advertising section going forward, you will need at least one Google advertising or publisher product linked to your Google Analytics 4 property: Google Ads, AdSense, AdMob, Google Ad Manager, or Google Marketing Platform (CM360, SA360, DV360). Publisher ads reports will move to the Advertising section going forward.
I know you just got used to the new reporting UI, but this is actually how the reporting should have been organized in the first place. I think you will find that when these changes roll out, data will be much more intuitively located, and there will be some additional campaign reporting features available as well (especially for GMP full-stack or multi-platform
The Curious Case of the Missing Metrics
One interesting development in Google Analytics 4 (both Standard and 360 properties) is the curious case of missing impressions. Truthfully, impressions are not so much missing as they are absent from GA4 . . . almost entirely.
This was planned for GA4, no doubt due to the increasing difficulty of reliably attributing impression-based performance within the analytics sphere.
There is no impression data in Google Analytics 4. Yes, you can still perform data imports with campaign data in GA4 as you could in Universal Analytics, but that does not qualify as true impression-level attribution in our book. That’s just dropping some data into a column for reporting purposes.
One more reason to kill the longed-for single source of truth mentality. Where martech, analytics, and adtech are concerned, I think the toolbox is a much better conceptual framework for what sophisticated marketers need: use the right tool for the task at hand.
GA4 is one of the tools in the marketer’s toolbox, and it has some powerful features, but if you want to know how impression and view-based media buys are driving business performance, then you better have another set of tools at your disposal.
Do You Know How to Access the Insights You Need?
If not, we could help you out!
Frequently Asked QuestionWhat are the main differences between Universal Analytics and Google Analytics 4 (GA4)?
Google Analytics 4 differs from Universal Analytics in its data model, collection methods, and reporting interface. GA4 uses an event-based data model rather than session-based, presents new standard reports, and offers different attribution models and integrations.
How does Google Analytics 4 handle user acquisition reporting compared to traffic acquisition?
GA4’s User Acquisition report shows the campaign or channel that drove a user’s first session and remains fixed for that user. In contrast, the Traffic Acquisition report shows the channels that generated each individual session, reflecting session-level traffic regardless of the user’s original acquisition source.
Does Google Analytics 4 use data-driven attribution (DDA) by default in all reports?
No. GA4 uses data-driven attribution by default only in certain reports, such as the Advertising section and Explore reports with Attribution dimensions selected. Many standard reports, like User Acquisition and Traffic Acquisition, use attribution logic more similar to first-click or last-click models.
Where can I find data-driven attribution insights in Google Analytics 4?
Data-driven attribution is applied by default in the Advertising reports (e.g., Performance > All Channels), Conversion Paths under Advertising > Attribution, and in the Explore section when using Attribution dimensions. These allow fractional conversion credit across multiple channels.
How should I choose between User Acquisition and Traffic Acquisition reports for analysis?
Use the User Acquisition report to understand how you acquired users initially (similar to first-click attribution). Use the Traffic Acquisition report to analyze how sessions are generated across channels (similar to last-click attribution). Combining these can provide deeper insights into multi-session user behavior.
Are impression metrics available in Google Analytics 4?
No, GA4 almost entirely lacks impression data. This omission is intentional due to challenges in reliably attributing impressions within analytics. For impression and view-based media performance, marketers need to use other tools beyond GA4.
What are some best practices for generating actionable insights from GA4 data?
Start with specific business questions that lead to actionable follow-up activities. Align analysis with marketing actions like audience targeting or suppression, use RFM metrics and propensity modeling to create audience segments, and include unstructured data exploration regularly to identify anomalies or opportunities.
What changes are coming to the Google Analytics 4 reporting interface?
Google is reorganizing reporting so that the Reports section focuses on user experience and behavior insights, while the Advertising section becomes the hub for campaign and channel performance. Access to Advertising reports will require linking at least one Google advertising or publisher product.
How does GA4’s event-based data model impact reporting compared to Universal Analytics?
GA4’s event-based model means data is collected and analyzed around user interactions (events) rather than sessions. This impacts how metrics like acquisition and conversion are attributed and reported, offering more flexibility but requiring new approaches to analysis.
Can I combine User Acquisition data with Traffic Acquisition data in GA4 reports?
Yes, in the Traffic Acquisition report you can add User Acquisition as a secondary dimension to analyze how users acquired through specific channels behave across sessions generated by other channels, providing a multi-dimensional view of user journeys.


