Choose another country or region to see content specific to your location.
Choose another country or region to see content specific to your location.

Your website has great products, competitive offers, and informative content. Yet, many of your users aren’t completing the user journey. Do you know why?
Your marketing team spends budget on campaigns that don’t seem to be converting. Are you targeting the right audience in the first place?
You have mountains of data but you’re not confident you can use it to make decisions. Naming conventions don’t make sense, numbers don’t match, and things just seem off. Has the underlying setup been configured correctly?
Trust your Web Analytics with e-CENS and start making data-informed decisions.
When you work with e-CENS on your Web Analytics, our expert team will:

Every website has a customer journey. Whether you’re an eCommerce site needing to drive users through the Checkout Funnel, a Content site with newsletter signups, or a B2B with ‘Request a Demo’ form fills, you need users to take specific actions.
If you don’t know how customers are navigating the process or where they’re dropping off, how can you improve?
A robust Web Analytics implementation empowers you to improve the customer experience. What might you learn?
Looking at totals doesn’t tell the full story – layering in your segmentation does.
Let’s say your total order volume and revenue is down for the month. You’re in trouble, right? Take it one step further and segment by product type. Turns out that orders on your high-revenue products are up. Even better, your subscription-based products with recurring revenue are up too!
One size doesn’t fit all when it comes to your marketing initiatives. The same goes for your website measurement!
It’s critical that your Web Analytics is designed with your key segments in mind. With our in-depth discovery and implementation process, you can better segment your website data and start making data-informed decisions.


We talk to different stakeholders across the organization to understand the business requirements. Working directly with your IT teams helps us understand the technical setup of your current Web Analytics. We learn what your business wants to achieve to bring you closer to your desired state. We spend a considerable amount of time understanding your business, your customers’ baseline behavior, and results. Some of the areas we cover with business stakeholders include:
Discovery with the IT team reveals what tools, technologies, and methods they use and whether what they have is sufficient to support business needs. When we find gaps, we recommend appropriate technical solutions to be put in place to track and collect sufficient behavioral data. Then, we verify that the data is collected correctly.
Discovery allows us to understand your customer journey across multiple touchpoints. Often, across different parts of your organization. One of our key deliverables is ensuring that multiple siloed data sources and multiple data inputs are combined into a single data output.
We connect all the separate data sources to enable the extraction of new, actionable insights.

e-CENS transforms your Key Business Requirements (KBR) into KPIs and metrics. Building on your requirements, we map them to all data points from your site, applications, and other sources. All complex online behavior information is captured using dimensions and metrics. We translate this data into a Metrics Architecture that is as unique as your business.
A key feature of an effective framework is proper and detailed naming conventions. It ensures that recipients understand the story the data tells.
Data analysis must be granular enough to reveal where the lift comes from. Consider, for example, a website streaming video content in multiple locations catering to different verticals or describing different offerings. We need to collect the overall video view insights, as well as detailed video consumption stats stratified by line of business, buyer category, video category, etc.
We identify and roll up the actions across customer segments, thereby delivering your Web Analytics Metrics Architecture that’s ready to be operationalized.

e-CENS transforms KPIs into the code on the technical platforms to ensure proper tracking. Data collected includes user interaction and behavior tracking, connecting results to actions – yours and visitors’. This is the phase when we are gathering data regarding failure points, success points, and anything in between.
We perform in-depth audits and regression testing to ensure the quality and accuracy of the analytics implementation on your website. We perform this exercise both in staging and production environments before publishing analytics developments into production. This rigor enables us to meet the business requirements in the minimum time while ensuring the quality delivered.

With Technical Implementation complete, you will have lots of data at your disposal – more than ever before. However, data that comes out of tracking at this point is semi-structured. Semi-structured or unstructured data doesn’t reveal much – until it goes through structuring and transformation.
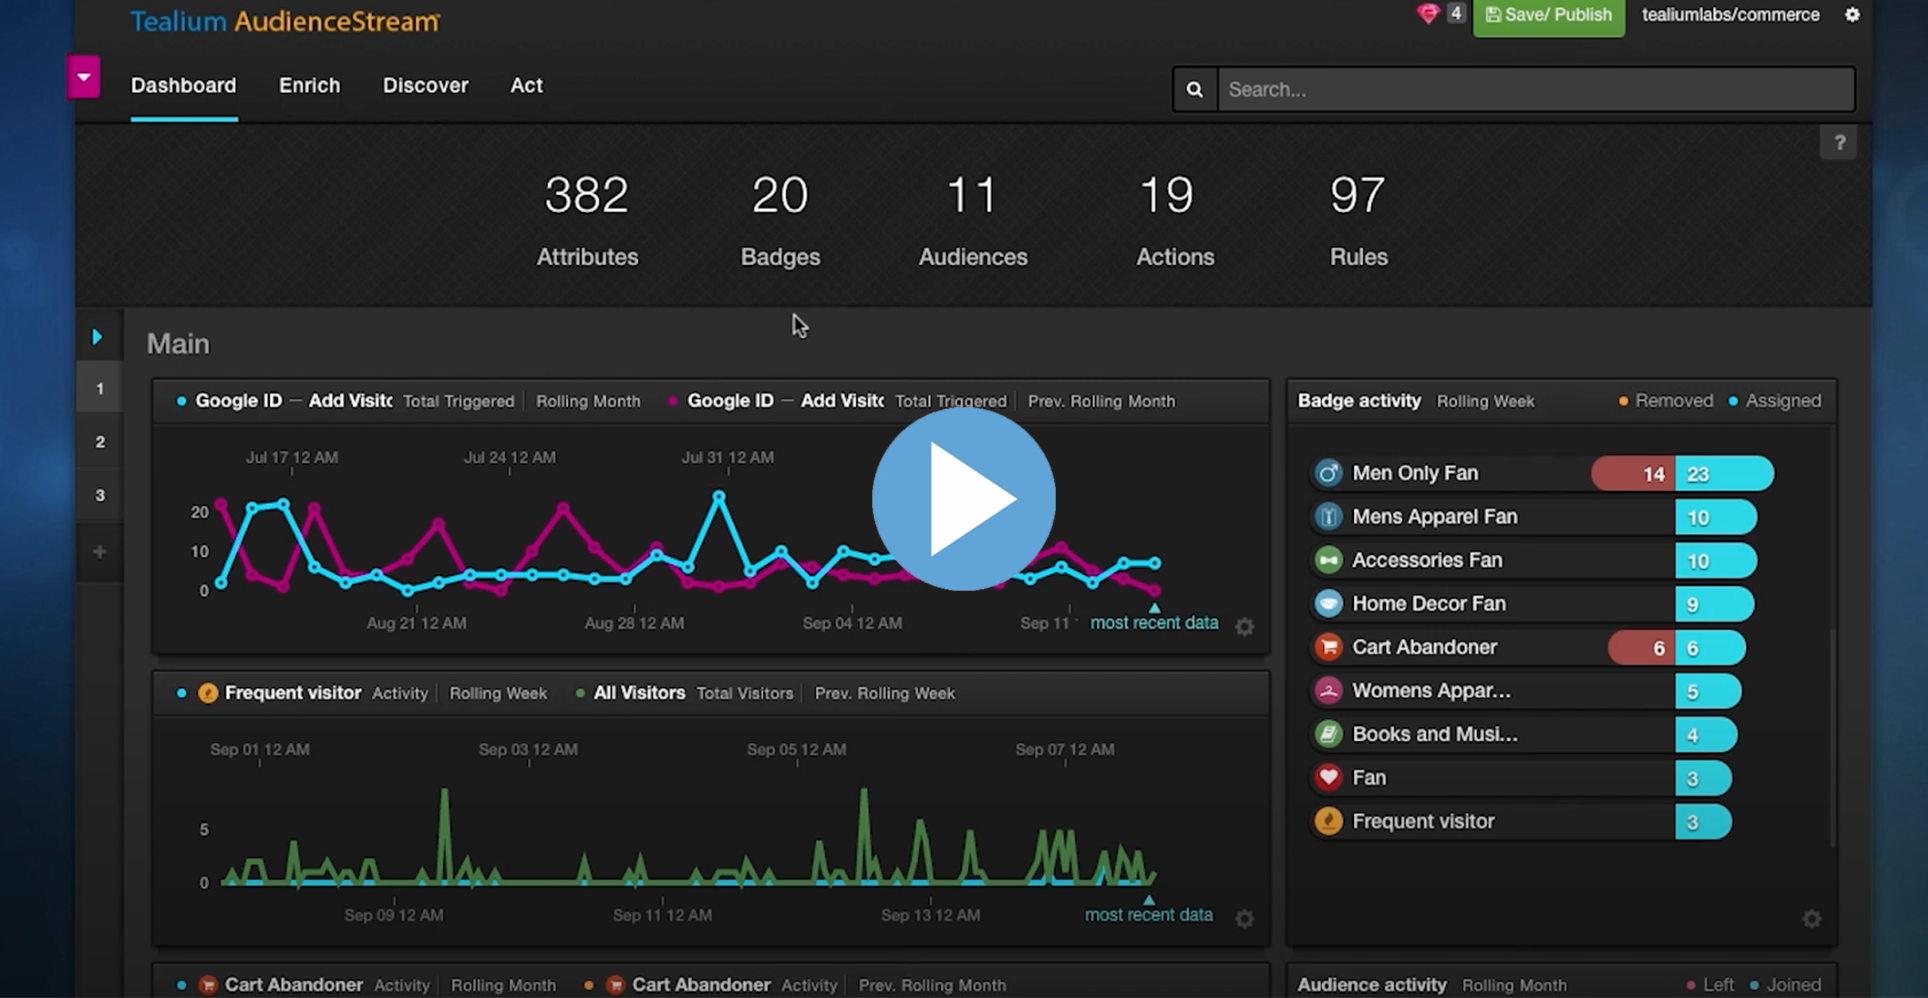
We create brand new data dashboards and visualizations for various business functions. These dashboards provide a unique and meaningful combination of dimensions and metrics for the various business users. They enable each function to discover hidden actionable insights.
Dashboarding is key to converting data into visually-accessible information. Your data will tell a story – many stories. Each stakeholder is provided with the insights they need without overloading them with unnecessary data. For example, business executives need profitability and projections. The IT team is equipped with real-time insights into the performance issues or JavaScript failures to address proactively.

In large organizations, no one person will use and own all the insights and findings we uncover during the engagement.
Finding deep, hidden, and actionable insights in the vast amounts of data could be a tedious job and most certainly requires years of experience in the domain. Here at e-CENS, we work closely with our clients to find these hidden gems with enormous value. We have demonstrated our ability to optimize the user experience and improve conversion rates.
At the end of the project, when all analysis is complete and recommendations are delivered, we help with the transition of the newly created analytics implementation. We support all teams to ensure they can independently maintain the solutions we delivered. It is vital that the technical solutions we built and the data structures we implemented continue providing insights again and again to your organization.
Therefore, every delivery includes training and coaching of your personnel to transfer everything we learned and ownership of tools installed. Such training is one of our core competencies. A critical component of our service is to ensure that you are self-sufficient moving forward.
Our engagement concludes with a checklist for ongoing maintenance of the new capability and a collaboration blueprint for multiple in-house teams.
We don’t force you to adopt any particular Web Analytics tool or to buy more technology. We work with what you already have – whether it’s Adobe Web Analytics or any tool on the market – we use multiple tools at a time, and we are familiar with them all.
Our creativity and comprehensive approach are not limited by a single software framework. We have a wider lens into the world of data than any one of the analytics software manufacturers offer.
During Dashboarding Phase, we will be using your data visualization tools or free Data Studio. If none of the available tools will have the required advanced capabilities, we will approach this subject with you to discuss potential additional capabilities required for your organizational needs.
The tools we work with include Tableau, Google Data Studio, DOMO, Google Analytics, Adobe Analytics.

Looking for “golden nugget” insights into your online audience?
Want to make more effective marketing investments?
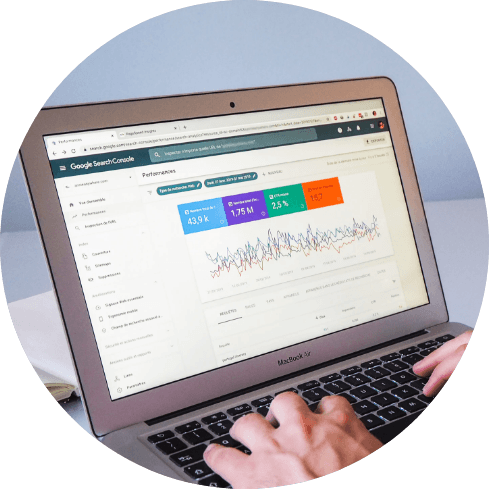
Website analytics is the practice of collecting, analyzing, and interpreting data about your website traffic and user behavior. It’s like having a window into how visitors interact with your website. This data provides valuable insights that can help you:
e-CENS’s web analytics consultants can help you track a wide range of metrics depending on your specific business goals. Here are some key examples:
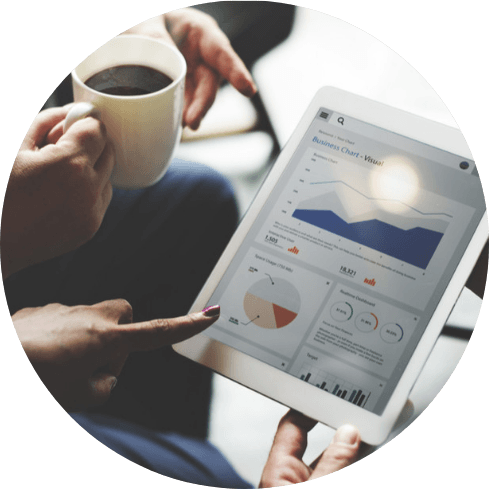
By leveraging website analytics, you gain a deeper understanding of your website visitors and their behavior. This empowers you to: