Choose another country or region to see content specific to your location.
Choose another country or region to see content specific to your location.
e-CENS’ Dashboards for Data Visualization and Reporting Service provides you with structured, enterprise-level reporting customized for each function and level.
Dashboards and insightful reports are the lifeblood of a successful organization. Without them, employees spend weeks (and sometimes months!) digging through data that doesn’t move the needle.
Averages and aggregations may hide the golden nuggets, and lack of micro-segmentation obscures major wins. Few teams have time to dig into every aspect that looks average.
Do you want to free your teams from hours of data handling and let them start analyzing?
We see this all the time: a leading company sells their products and services across digital and offline channels. They have a wealth of data at their fingertips yet a shortage of insights. They struggle to make sense of the data at the channel level, let alone to see the cross-channel trends and patterns.
Do you have a single, cross-channel report that tells you which channel has the highest ROI and where the optimization investments are most needed? How about a consolidated view of all product sales across your business lines?
If this is familiar – it’s time for your business to invest in enterprise dashboards. Save time and resources, and enjoy clear answers to your day-to-day questions.

e-CENS is a tool-agnostic data visualization provider. We work with industry-leading tools, such as Tableau, Looker Studio (formerly Data Studio), Microsoft BI, DOMO, Looker, and more.
We are happy to apply your current toolset in our Reporting and Dashboard implementation.
Whether you’re looking for a full overhaul of your reporting or just need a simple tune-up, e-CENS is here to support you. We can recommend the best options based on your requirements, budget, and preferences.
e-CENS’ dashboards enable quick and smart decisions at all levels of your organization, positioning your company to be more agile: test and iterate faster than competitors.
On the other hand, good dashboards lead to important and consistent discoveries and improve your customer relationships, selling practices, and overall results.
It is time to find and leverage valuable insights that help you move the needle.
Dashboards and insightful reports are the lifeblood of a successful organization. Without them, many human-days and weeks are spent on meaningless data handling that provides no clues into which decisions and changes move the needle in very competitive markets.
Averages and aggregations may hide the golden nuggets, and lack of micro-segmentation obscures major wins. Few teams have time to dig into every aspect that looks average.
Do you want to free your teams from hours of data handling and analyze it instead?


Your organization is composed of multiple teams collaborating yet responsible for different aspects of running the business. They all require different inputs and are in charge of different KPIs to measure the results and effectiveness behind the activities they implement.
Are you ready to have one single source of truth?
e-CENS deploys a time-tested methodology to design and deploy the best-in-class reports and dashboards.
In this phase, we meet with the client team and multiple individuals from different departments to discuss and collect everyone’s wishes and needs. We collectively brainstorm to document all the requirements into a comprehensive set of specs. This step results in the clarification of objectives, KPIs, and desired results, detailing the applicable dimensions and timeframes.
We account for different needs at different levels. Executive dashboards are very different from those revealed to employees responsible for campaigns or specific products.
Typical roles and functions involved in requirements gathering include:

At this step, we design and create new variables, calculations, perform data modifications, merges, deduping, and a variety of other operations. Typically, this step creates a substantially new dataset that the client organization did not have prior. This preparation work is necessary to connect data from disparate sources into a unified view and design data-element interactions in dashboards in ways that do not exist in native sources.

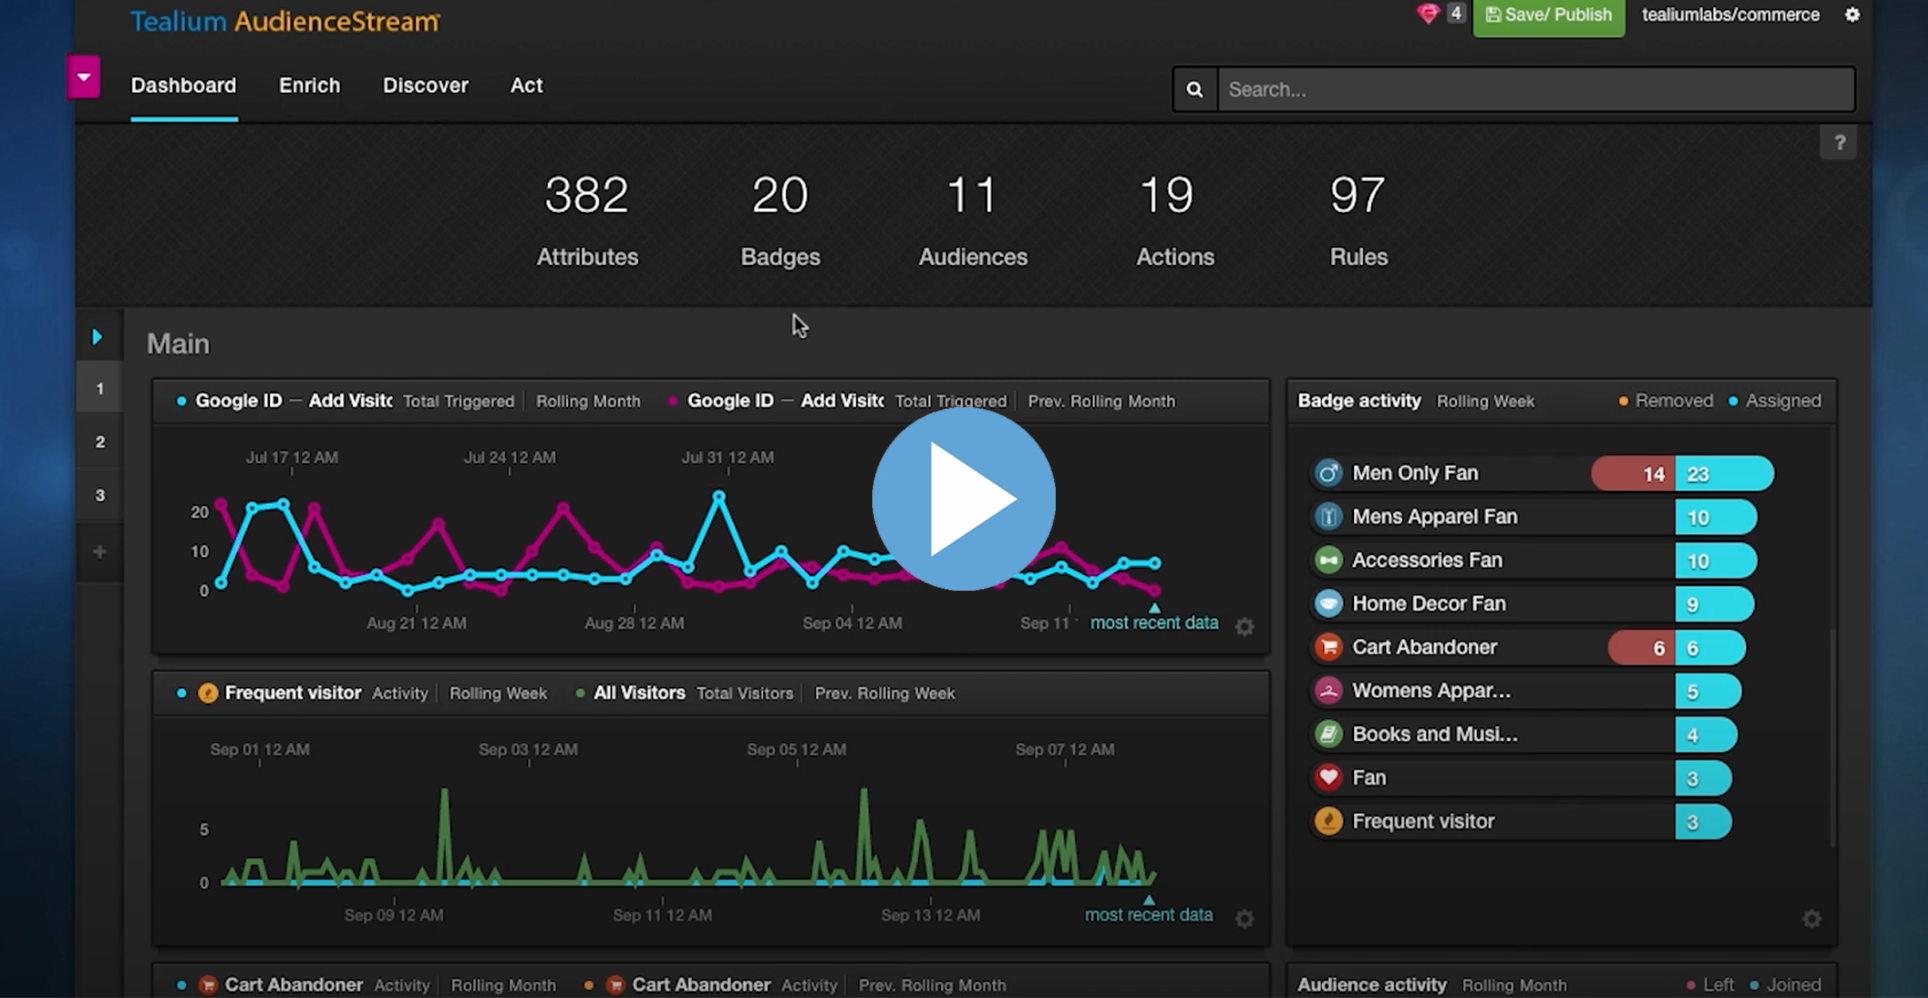
We apply the most appropriate visualizations to accommodate each set of metrics and data, creating an interactive experience to tell the story of your data.
The best visual dashboard allows users to connect data from multiple data sources, blending them in new ways, and presenting them intuitively to support easy interpretation.
e-CENS’ expertise includes information visualization and consumption psychology, guiding us to provide the right types of visuals for each story the dashboard is telling. We deploy the most appropriate charts and visuals to display the mix of multiple dimensions, views, timelines, and other data-control elements.
Dashboards ultimately roll up into just a couple of screens to provide a comprehensive overview of the organization at a glance.
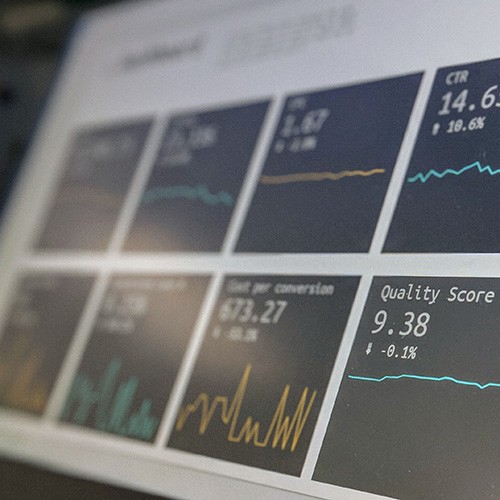
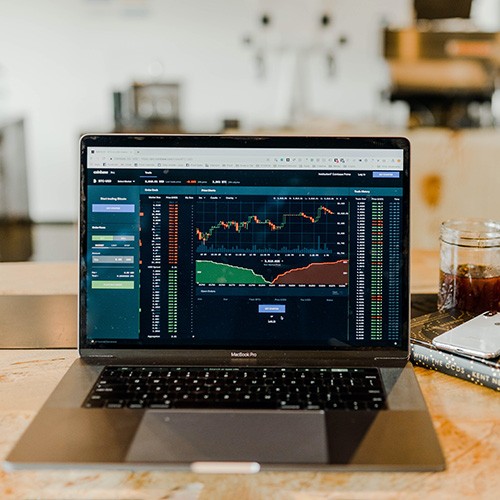
e-CENS designs and implements a variety of dashboards. These are some of the samples used for demonstration purposes:

Your organization likely has a variety of marketing automation tools, eCommerce SaaS tools, online applications, internal systems housing purchase data, social media tools, and more. Each tool you purchase comes with its own internal reporting and all house bits and pieces of the overall picture, while none provides a unified view into all the data.
None of these toolsets enables fully integrated data visibility simultaneously for the bottom-up view (from individual customer transactions up to the total revenue) or the top-down view (a view of total results as a combination of individual transactions).
There are two ways to build a Google Dashboard:
Typically, clients require the advanced visualizations available through Google Data Studio. Google Data Studio is a superior option allowing data connection of multiple data sources, including leading marketing automation tools. It combines custom dashboard configuration with powerful pre-built templates that help speed up dashboard design and implementation.
Versatility is the biggest benefit of Google Dashboard. Highly-customizable, it supports multiple views into the same set of data for the different teams inside your organization.
Your e-CENS team will help you evaluate whether a Google Dashboard best suits your situation or recommend a more suitable alternative.
Google Dashboard is generally considered to be a mid-market solution. But, enterprise organizations often require more advanced visualization than Google Data Studio dashboard supports. Generally, businesses with the most complex needs may require another commercial reporting and data visualization tool.
We work with all dashboarding tools and provide impartial and independent recommendations. These are solely based on your business requirements and budget, not our vendor affiliations.


Ready to create a single clear and comprehensive source of truth for your organization?
Contact us for more information and to discuss your Data Visualization needs.
Data Visualization is the art of presenting information in a clear and visually appealing way. It transforms complex data sets into charts, graphs, and other visual elements, making it easier to understand trends, patterns, and relationships within your data.
Regardless of your industry or location, Data Visualization offers significant benefits:
Data visualization plays a crucial role in empowering businesses to make data-driven decisions. Here’s how:
Data visualizations are powerful tools, but their effectiveness hinges on how well they’re designed. Here are some key best practices to follow: