
I. Introduction: The Critical Gap Between ‘What’ and ‘Why’ in Product Analytics
Your most important funnel chart shows a 40% drop-off during onboarding. Your analytics tell you what is happening with perfect clarity. But they can’t tell you the most important thing: why. How do you bridge this critical gap between observing user behavior and truly understanding it, without waiting weeks for external user research to provide clues?
This is the fundamental challenge in modern product management. Relying solely on quantitative analytics often leads to hypotheses based on guesswork, which can result in wasted development cycles building solutions for the wrong problems. To iterate effectively and build products that resonate, you need to connect the data of user actions to the voice of user intent.
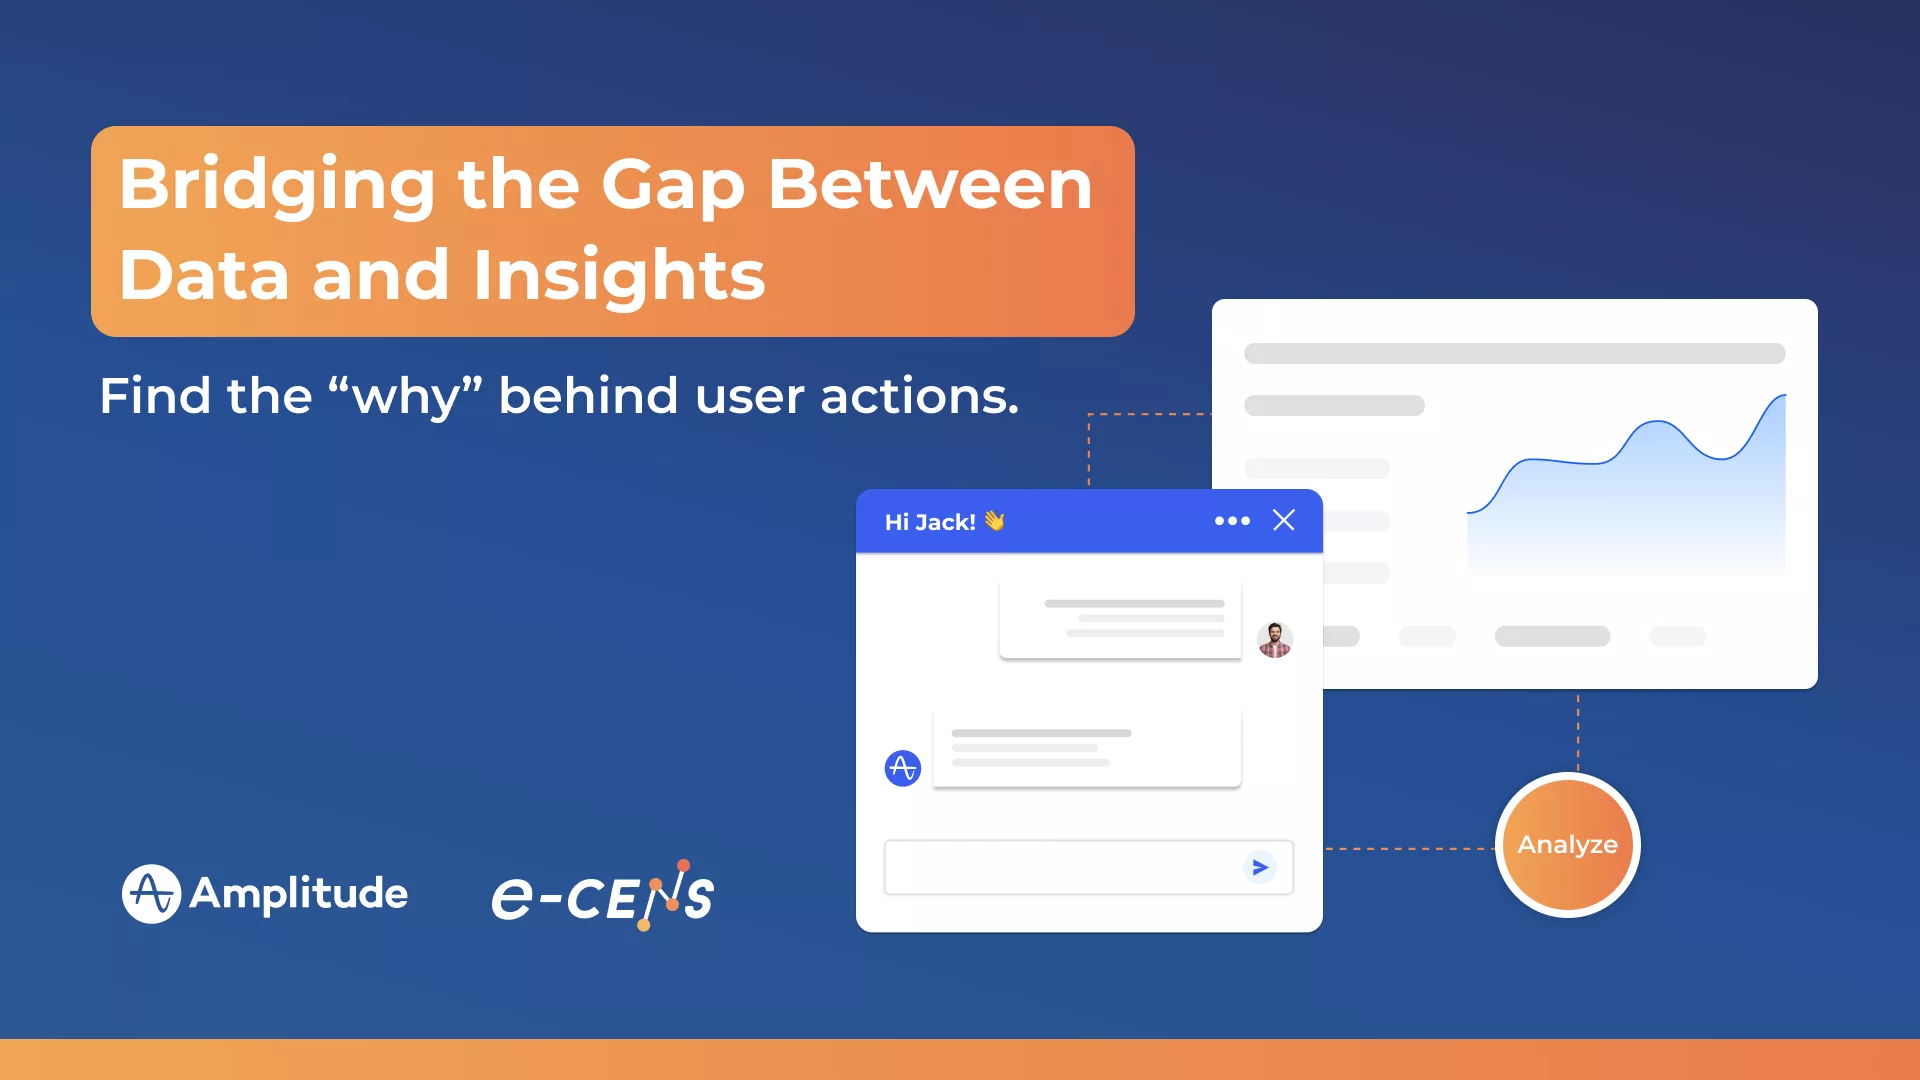
This is where Amplitude Guides and Amplitude Surveys become essential. They are the integrated solution within the Amplitude platform designed specifically to close this loop. These tools allow you to move from being a passive analyst of data to an active participant in the user experience, enabling you to engage users and collect insights directly within your product, at the precise moment of action.
This post provides a strategic playbook for using Amplitude Guides and Surveys in tandem. We will explore specific use cases for each, but more importantly, show you how to combine them to create a powerful, continuous product feedback loop that accelerates learning, drives user adoption, and uncovers the deep user insights needed for sustainable growth.
II. The “Push”: Proactively Guiding Users to Success with Amplitude Guides
The first half of our feedback loop is about proactive intervention. Once your analytics reveal an opportunity to improve the user experience, you need a way to act on it. Amplitude Guides are your tool for this “push”—delivering in-app messages that proactively guide users towards “aha!” moments, improve activation, and drive the adoption of key features.
What are Amplitude Guides?
Simply put, Guides are in-app messages like tooltips, banners, and multi-step product tours or walkthroughs. Their power comes from the ability to be surgically targeted to specific user segments based on the rich behavioral data you already have in Amplitude.
Use Case 1: Optimizing New User Onboarding
- The Challenge: Your analytics show that new users who fail to use a critical activation feature in their first session are significantly more likely to churn.
- The Action: Design a multi-step Guide that triggers automatically for first-time users. This product tour can walk them through the exact steps needed to use that key feature, highlighting its core value proposition along the way.
- The Strategic Payoff: You are no longer passively hoping users discover value. You are actively guiding them to it. This can be directly measured by tracking the activation rate and Day 7 retention for users who completed the Guide versus those who didn’t, proving a clear ROI on the intervention.
Use Case 2: Driving New Feature Adoption
- The Challenge: You’ve launched an innovative new feature, but your analytics dashboards show a low adoption rate among your established, long-term users who could benefit from it most.
- The Action: First, create a Behavioral Cohort in Amplitude of “Active users who have not used Feature X.” Then, target this specific cohort with a simple, non-intrusive tooltip Guide. The next time a user from this cohort logs in and navigates near the feature, the tooltip can appear, pointing out the new functionality and its key benefit.
- The Strategic Payoff: This targeted approach respects your existing users’ experience while ensuring they are aware of new value. You can directly measure the adoption rate of the new feature among the cohort that saw the Guide, providing clear data on the effectiveness of your in-product announcement and educational efforts.
III. The “Pull”: Uncovering the ‘Why’ with Amplitude Surveys
While Guides are for proactive intervention, Amplitude Surveys are your tool for reactive insight collection. This is the “pull” in our feedback loop—the mechanism for gathering targeted, in-context qualitative feedback to diagnose problems, understand user sentiment, and uncover the motivations behind the quantitative data you see in your analytics charts.
What are Amplitude Surveys?
Surveys are simple, short questionnaires that you can trigger to appear in-app based on a user’s specific behavior or cohort membership. They can take various forms, including Net Promoter Score (NPS), Customer Satisfaction (CSAT), star ratings, multiple-choice questions, or open-ended text responses.
Use Case 1: Diagnosing Funnel Drop-offs
- The Challenge: Your funnel chart clearly shows a massive drop-off at a specific step in your checkout process. You have multiple hypotheses (pricing, shipping, UI confusion) but no definitive evidence.
- The Action: Create a Behavioral Cohort of users who started the checkout but abandoned it at that exact step. Target this specific segment with a simple, one-question, open-ended Survey that triggers either on their way out (exit intent) or the next time they visit. The question could be: “What was the main reason you didn’t complete your purchase today?”
- The Strategic Payoff: Instead of guessing, you are collecting direct, qualitative feedback from the most relevant user group at the most relevant time. Analyzing these open-ended responses can provide a powerful, clear signal, often revealing that the issue is something you hadn’t even considered (e.g., “I couldn’t find the option to use my gift card”). This replaces guesswork with a data-informed hypothesis for your next A/B test.
Use Case 2: Measuring User Sentiment Post-Action
- The Challenge: You want to measure user satisfaction with a newly redesigned feature or a critical workflow, like exporting a report. A generic, delayed email survey often suffers from low response rates and recall bias.
- The Action: Trigger a simple CSAT or star-rating Survey to appear immediately after a user successfully completes that key event (e.g., Report Exported).
- The Strategic Payoff: You gather in-the-moment sentiment data that is directly tied to a specific product experience. This provides much more accurate and context-rich feedback than a generic survey sent days later. Tracking this sentiment score over time allows you to quantitatively measure how iterative improvements to that feature are impacting user satisfaction.
By using Surveys strategically, you give your users a voice directly within your product, providing the crucial qualitative context needed to truly understand the numbers and make smarter, more empathetic product decisions.

IV. The Power Combination: Architecting Your Product Feedback Loop
We’ve explored how Amplitude Guides can proactively influence user behavior and how Amplitude Surveys can reactively gather qualitative insights. The true strategic advantage, however, comes from combining them with your core analytics into a powerful, repeatable product feedback loop.
This closed-loop system allows you to move seamlessly from data-driven observation to direct user feedback, and then to informed intervention—dramatically accelerating your product iteration and learning cycles. Here’s a practical, four-step process for architecting this loop.
Step 1: ANALYZE – Identify a Problem or Opportunity in Your Data
This is your starting point. Use Amplitude’s core analytics charts (Funnels, Retention, Pathfinder, etc.) to identify a statistically significant area for improvement. This could be a high drop-off rate in a critical funnel, a low adoption rate for a new feature, or a behavioral pattern that correlates with churn.
- Example: Your Funnel Analysis chart shows a 60% drop-off between Trial Started and First Project Created.
Step 2: SURVEY – Ask “Why?” at the Point of Friction
Once you know what is happening, the next step is to understand why. Target the specific user segment identified in Step 1 with an in-app Survey to gather immediate, in-context qualitative feedback.
- Example: You create a cohort of users who started a trial but did not create a project within their first 24 hours. You then target this cohort with a simple, open-ended Survey that asks, “What was the biggest thing that prevented you from creating your first project today?”
Step 3: HYPOTHESIZE & GUIDE – Form a Hypothesis and Intervene
The qualitative feedback from your Survey provides the direct “voice of the customer” needed to form a strong, data-informed hypothesis. You are no longer guessing. You can now design a proactive intervention using an Amplitude Guide to address the specific issue uncovered.
- Example: The survey responses overwhelmingly indicate, “I wasn’t sure what to do first.” Your hypothesis becomes: “Providing clearer initial guidance will increase the project creation rate.” You then create a simple, multi-step Guide that triggers for all new trial users, walking them through the three steps to create their first project.
Step 4: MEASURE – Analyze the Impact of Your Intervention
This is where you close the loop. Use Amplitude’s analytics to measure the impact of your intervention. You can A/B test the Guide against a control group to isolate its effect or simply monitor the overall funnel conversion rate before and after the Guide was launched.
- Example: You monitor the Trial Started to First Project Created funnel conversion rate. After launching the Guide, you see the conversion rate improve from 40% to 55%.
The Payoff: A Rapid, Continuous Improvement Engine
This four-step process—Analyze, Survey, Guide, Measure—creates a powerful, continuous improvement engine that lives entirely within your product and is powered by the integrated Amplitude platform. It transforms your team from being passive observers of data into active, data-informed drivers of product improvement, ensuring that your development efforts are consistently focused on solving real, validated user problems.
V. Best Practices for Effective In-Product Engagement
Deploying Amplitude Guides and Surveys is straightforward, but deploying them effectively requires a strategic and user-centric approach. To ensure your in-app messages are helpful interventions rather than disruptive annoyances, adhere to these essential best practices.
1. Be Surgical with Your Targeting
The power of Amplitude’s engagement suite lies in its connection to deep behavioral data. Avoid the temptation to blast a generic Guide or Survey to your entire user base. Instead, use Behavioral Cohorts to be surgical with your targeting. Send messages only to the specific, relevant user segments who can benefit from the information or provide the most valuable feedback. This ensures relevance and respects your users’ time and attention.
2. Keep It Short and In-Context
Users are in your product to accomplish a task. In-app communications should be designed to help, not hinder, that process. Keep your Guides and Surveys as concise as possible. A one-question survey triggered at the right moment is far more effective than a long questionnaire. A brief tooltip pointing out a feature is less disruptive than a full-screen takeover. Relevance is a function of both timing and brevity.
3. Design for a Seamless User Experience
Your in-app messages are part of your product’s user experience, and their design should reflect that. Ensure that the look and feel of your Guides and Surveys (colors, fonts, tone of voice) are consistent with your brand and your product’s native UI. Critically, make sure they are easy for a user to dismiss if they are not interested. A user should never feel trapped by an in-app message.
4. Always Have a Clear Goal and Hypothesis
Never launch a Guide or a Survey without a clear objective. Every in-app engagement should be tied to a specific, measurable goal and a well-defined hypothesis.
- For a Guide: “We hypothesize that showing this tooltip to new users will increase the adoption of Feature X by 15%.”
- For a Survey: “We hypothesize that surveying users who abandon the cart will reveal that shipping cost is the primary point of friction.”
This discipline ensures that your efforts are purposeful and that you can clearly measure the success and ROI of each intervention.
Okay, Patrick here. Let’s write the concluding Section VI. This needs to effectively summarize the strategic shift from passive analysis to active engagement, reinforce the core value proposition of the feedback loop, and provide a clear, professional call to action.
VI. Conclusion: From Passively Analyzing to Actively Engaging
By integrating Amplitude Guides and Amplitude Surveys with your core analytics, you fundamentally change your relationship with your users and your data. You evolve from being a passive observer of trends to an active participant in the user experience. This is the critical shift from simply analyzing what users have done to actively guiding them towards success and asking them why they do what they do, all in real-time.
The strategic, four-step feedback loop—Analyze, Survey, Guide, Measure—provides a powerful, continuous improvement engine. It allows you to:
- Accelerate product iteration by rapidly moving from quantitative insights to qualitative validation and then to data-informed intervention.
- Deepen user understanding by combining the “what” of analytics with the “why” of direct user feedback.
- Directly connect your efforts to measurable business outcomes like improved activation, higher feature adoption, and stronger long-term retention.
This integrated approach ensures that your product development and user engagement strategies are consistently grounded in a deep, empathetic, and data-driven understanding of your customers.
Architecting an effective in-product feedback and guidance strategy requires a solid data foundation and a clear plan for turning insights into action. If you’re ready to leverage Amplitude’s full suite to not only analyze but also actively engage your users for maximum product growth, our team at e-CENS is here to help you build that strategy.

Frequently Asked QuestionWhat is the main challenge in product analytics addressed by Amplitude Guides and Surveys?
The main challenge is bridging the gap between knowing “what” users do through quantitative analytics and understanding “why” they behave that way. Amplitude Guides and Surveys help connect user actions with user intent by enabling real-time engagement and feedback collection within the product.
What are Amplitude Guides and how do they improve user onboarding?
Amplitude Guides are in-app messages such as tooltips, banners, and multi-step product tours targeted to specific user segments based on behavioral data. They improve onboarding by proactively guiding new users through key activation steps, increasing feature adoption and retention by helping users discover value faster.
How can Amplitude Surveys help uncover the reasons behind user behavior drop-offs?
Amplitude Surveys are short, targeted questionnaires triggered in-app based on user behavior or cohort membership. They allow product teams to collect qualitative feedback directly from users at points of friction (e.g., checkout abandonment), revealing specific reasons behind drop-offs and replacing guesswork with actionable insights.
What is the four-step product feedback loop using Amplitude’s tools?
The four-step loop consists of:
Measure – Use analytics to assess the impact of interventions and iterate accordingly.
Analyze – Identify a problem or opportunity using analytics.
Survey – Ask “why” through targeted in-app surveys to gather qualitative insights.
Hypothesize & Guide – Form hypotheses and intervene using Amplitude Guides to proactively improve user experience.
How do Amplitude Guides and Surveys work together to drive product growth?
Guides offer proactive, data-driven interventions that push users toward key actions, while Surveys pull in contextual user feedback to understand motivations and pain points. Together, they create a continuous feedback loop that accelerates learning, improves adoption, and aligns product development with validated user needs.
What are best practices for deploying Amplitude Guides and Surveys effectively?
Key best practices include:
Setting clear goals and hypotheses for each engagement to measure success and ROI accurately.
Targeting messages precisely using behavioral cohorts to ensure relevance.
Keeping communications short, timely, and contextually appropriate.
Designing guides and surveys consistent with product UI and brand, allowing easy dismissal.
How does integrating Amplitude’s tools shift product management strategy?
It shifts teams from passive data observers to active participants in the user experience, enabling real-time guidance and feedback collection. This leads to faster iteration cycles, deeper user understanding, and stronger connections between product efforts and measurable business outcomes like activation, adoption, and retention.
When should you trigger an Amplitude Survey for measuring user sentiment?
Surveys measuring sentiment like CSAT or star ratings should be triggered immediately after a user completes a critical event (e.g., exporting a report) to capture in-the-moment feedback that is more accurate and context-rich than delayed surveys.
How can you measure the impact of an Amplitude Guide intervention?
By using Amplitude’s analytics tools to track relevant funnel conversion rates or feature adoption before and after launching the Guide. A/B testing can also isolate the Guide’s effect by comparing behavior between users who saw the intervention versus a control group.
What role does behavioral cohorting play in using Amplitude’s engagement tools?
Behavioral cohorts allow precise segmentation of users based on their actions or attributes. This enables surgical targeting of Guides and Surveys only to relevant segments, ensuring interventions are personalized, less disruptive, and more effective at driving desired outcomes or gathering useful feedback.


