I. Introduction: The “So What?” Crisis in Analytics
Your dashboard is pristine. The data is validated. The charts show a clear upward trend in traffic. Yet, when you present it to the Board, the CEO asks a single, devastating question.
“So what?”
If you cannot answer that question immediately, your analytics team is viewed as overhead rather than an asset.
This is the crisis of modern business intelligence. Organizations are drowning in data but starving for answers. We have invested millions in cloud infrastructure and visualization tools. We have solved the problem of access. We have not solved the problem of value.
Most teams suffer from “Analysis Paralysis.” They confuse reporting with analysis. They deliver pages of observations about what happened last week. They fail to articulate why it matters or how the business should respond.
The Shift to Revenue-Driven Analysis
The goal of analytics is not to produce reports. It is to produce money.
To bridge this gap, you must move beyond passive observation. You must master the skill of generating insights that force a decision.
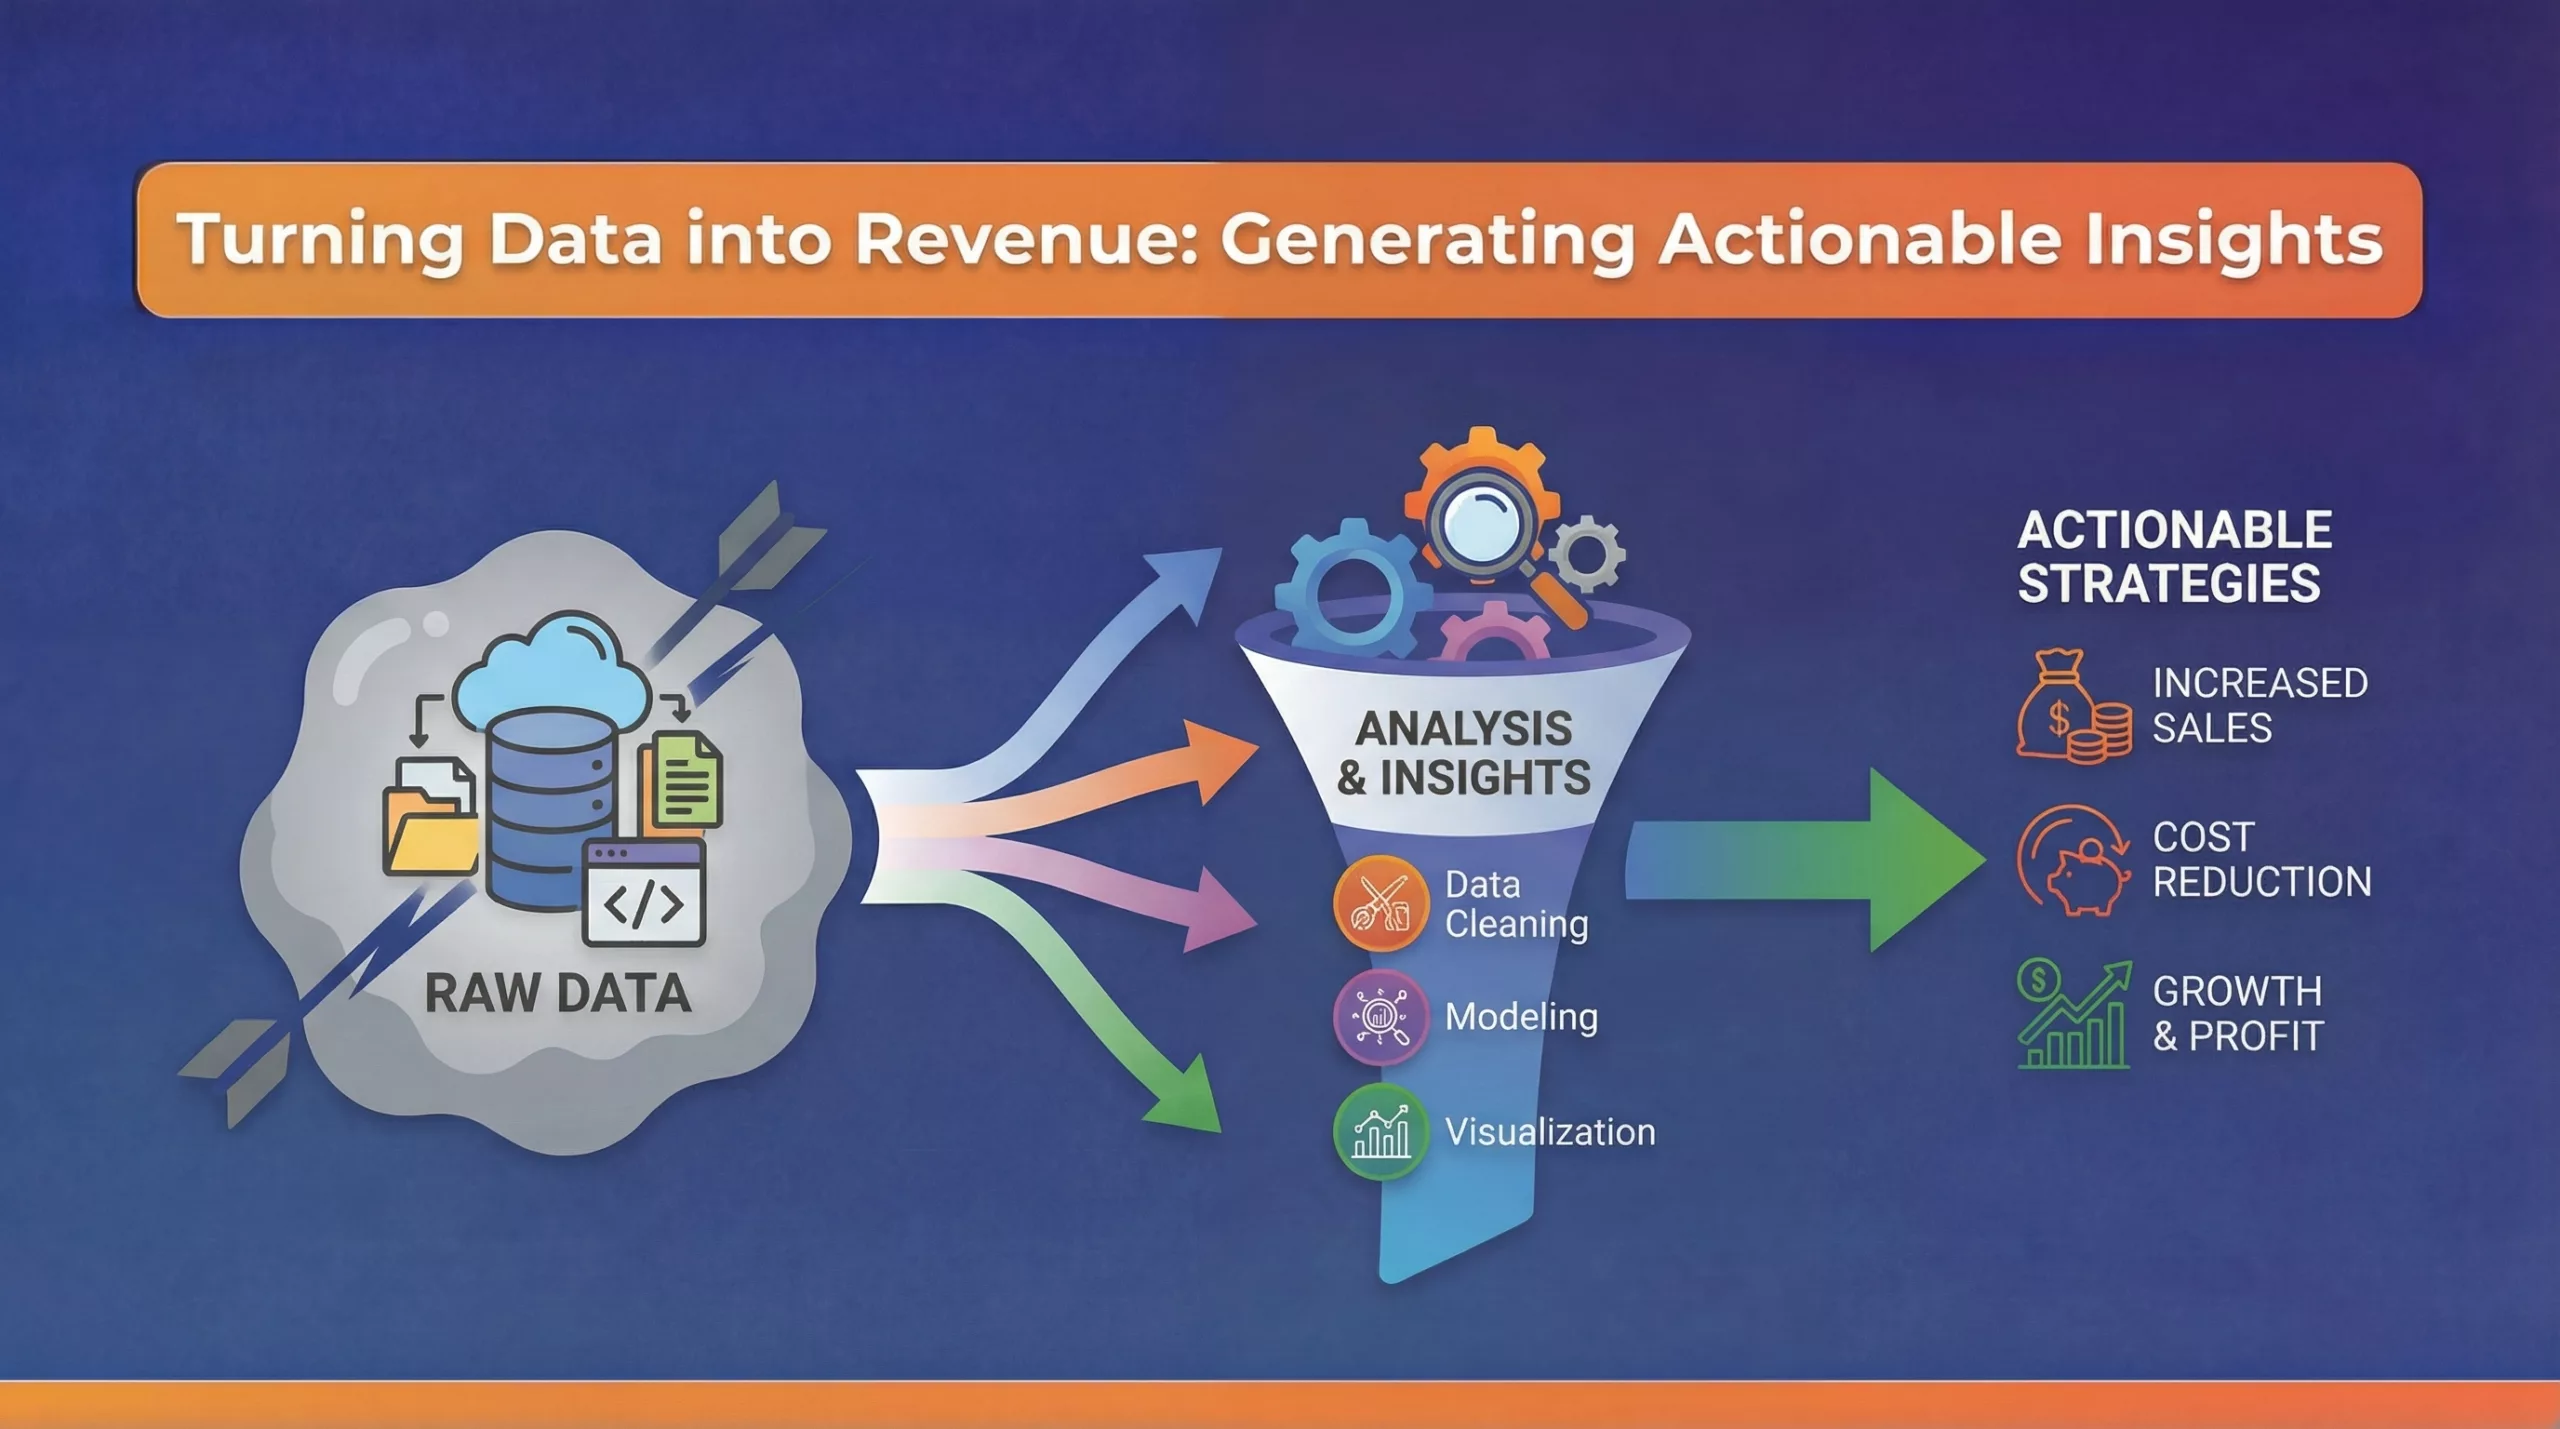
This guide provides a rigorous strategic framework for converting raw data into revenue. We will define exactly what separates a “fact” from an “actionable insight.” We will introduce the “5 Whys” methodology for digging past the surface symptoms to find the root cause of performance issues. We will look at real-world examples from retail and banking to see how this framework applies in practice.
It is time to stop reporting the news and start making it.
II. Definition: Observation vs. Insight
The first step to fixing your data culture is defining your terms. A report full of accurate numbers can still be useless if it lacks meaning.
Most analytics deliverables stop at the level of Observation.
The Observation (The “What”)
An observation is a statement of fact. It describes the state of the world. It is objective. It is often interesting. However, it is passive.
- Example: “Mobile traffic increased by 15% last month.”
- Example: “The bounce rate on the homepage is 45%.”
- Example: “Our email open rate dropped on Tuesday.”
These are facts. They are necessary, but they are not sufficient. An observation puts the burden of interpretation on the stakeholder. It forces the CEO to ask, “Is that good? Is that bad? Why did it happen?” When you deliver observations, you are asking your boss to do the analysis for you.
The Actionable Insight (The “Why” and “How”)
An insight combines the observation with context, causality, and value. It removes the ambiguity. It tells a story that ends with a recommendation.
- Example: “Mobile traffic increased by 15% because our new LinkedIn campaign targets Android users. However, mobile conversion is flat because the landing page load time on 4G networks is too slow. We are paying for traffic that cannot convert.”
This statement is no longer just a fact. It is a diagnosis. It implies a specific corrective action: fix the page speed.
The Three Criteria of Actionability

To determine if you are generating insights or just reporting news, apply this three-part litmus test to your analysis.
1. Is it Novel?
Does this tell the stakeholder something they did not already know? Reporting that “Sales go up during Black Friday” is not an insight. It is common knowledge. An insight must reveal a hidden pattern or challenge an existing assumption.
2. Is it Relevant?
Does this metric connect directly to a business objective? You might find an interesting correlation between weather patterns and blog traffic. Unless you can monetize that correlation, it is trivia. Clear insights map directly to revenue, cost reduction, or risk mitigation.
3. Is it Actionable?
This is the most critical filter. Can the business actually do something about it?
If you report that “The market is shrinking due to a global recession,” that is a valid observation. It is relevant. It is not actionable. You cannot fix the recession.
However, if you report that “Our competitors are winning market share by lowering shipping costs,” that is actionable. You can adjust your shipping policy.
The “So What?” Test
Before you send any report, look at every chart and ask yourself: “So what?”
If the answer is “It is good to know,” delete the chart.
If the answer is “We need to reallocate budget from Campaign A to Campaign B to save $5,000,” you have found an insight.
III. The Framework: The “5 Whys” of Data Analysis
Finding an insight is an investigation. Like any investigation, the first clue is rarely the solution. It is usually just a symptom.
If you stop your analysis at the symptom, you will apply a band-aid solution. The problem will return. To generate actionable strategies that protect revenue, you must find the root cause.
We use the “5 Whys” framework. Originally developed by Sakichi Toyoda for the Toyota Motor Corporation, this method forces you to peel back layers of causality until you find the fundamental issue.
The Methodology in Action
Let us apply this to a common digital scenario. Imagine your weekly report shows a sudden drop in revenue.
The Observation: Total Revenue dropped by 15% on Friday.
Most teams stop here. They might react by launching a flash sale to make up the numbers. This reacts to the symptom. It ignores the disease.
Let us apply the 5 Whys.
1. Why did revenue drop?
Analysis: We look at the breakdown by traffic source and device. Traffic volume was stable. However, the Conversion Rate dropped significantly.
2. Why did the Conversion Rate drop?
Analysis: We inspect the funnel steps. The “Add to Cart” rate is normal. The drop-off is happening specifically at the “Confirm Payment” step.
3. Why are users dropping off at Payment?
Analysis: We segment the data by browser. The drop-off is almost entirely isolated to users on the latest version of the Safari browser on iOS.
4. Why is Safari failing?
Analysis: We consult the engineering logs and session replay tools. We see that a JavaScript error is triggering on the payment button, preventing the click action. This error only appears on WebKit browsers.
5. Why is there a JavaScript error?
Analysis: We check the release log. The development team pushed a code update on Thursday night. That update included a script that is incompatible with the latest Safari privacy protocols.
The Strategic Conclusion
By asking “Why” five times, we moved from a revenue problem to a code deployment problem.
- The Shallow Fix: “Send more emails to make up for lost sales.” This wastes margin.
- The Root Cause Fix: “Roll back the Thursday code deployment and update our QA testing protocols to include the latest Safari version.”
This is the difference between a panicked reaction and a strategic response. The “5 Whys” framework forces you to connect the dots between business outcomes and technical realities. It turns a confusing data point into a clear instruction for the engineering team.
Questions of Analysis
To make this a habit, your analysts should never present a metric without a chain of causality. When building your dashboards or presentation decks, structure your narrative around this depth.
- What happened?
- Why did it happen?
- Why is that the reason?
- What do we do next?
If you cannot complete the chain, you are not ready to present.
IV. Industry Examples: From Data to Dollars
The difference between a cost center and a profit center is the ability to close the loop. An analytics team becomes profitable when their findings reduce waste or increase efficiency.
Let us look at two specific scenarios where generating insights saved the quarter.
Scenario A: The Retail Margin Crisis (The High Cost of Returns)
- The Context: A fashion retailer sees strong top-line sales for their new winter coat collection. Marketing celebrates the high conversion rate.
- The Observation: Two weeks later, the finance team flags a problem. The return rate for this specific collection is 40%. This destroys the profit margin. Logistics costs are skyrocketing.
- The Lazy Analysis: “Customers are fickle. The product must be low quality. We should discount it to clear inventory.” This reaction destroys brand value.
- The Actionable Insight: The analyst digs deeper.
- Why are they returning? The primary reason code is “Item too small.”
- Why is it too small? They compare the SKUs to the customer reviews. The reviews consistently state, “Runs two sizes smaller than the chart.”
- Why is the chart wrong? The web team uploaded a generic size guide instead of the supplier-specific chart for this brand.
- The Strategic Fix: The analyst flags this to the Content team. They update the size guide page with a warning: “Fits small. Order one size up.” They also email recent buyers with a proactive exchange offer before the frustration sets in.
- The Revenue Impact: Returns drop to 15%. Net sales increase. Customer trust is preserved. The insight saved the season.
Scenario B: The Banking Application Drop-Off (The Hidden Technical Debt)
- The Context: A regional bank launches a new digital loan application. They spend heavily on paid search to drive traffic.
- The Observation: Traffic is high. The “Start Application” click rate is excellent. However, the completion rate is abysmal. Only 5% of users finish the form. The Cost Per Lead (CPL) is $200 higher than the target.
- The Lazy Analysis: “The leads are low quality. The form is too long. We need to shorten the questions.” This ignores the compliance requirements of the bank.
- The Actionable Insight: The analyst applies the 5 Whys.
- Where are they dropping off? The exit page is consistently the “Upload Identity Document” step.
- Who is dropping off? It is isolated to users on Android devices.
- Why Android? Session replay tools show users clicking the “Upload” button repeatedly with no response.
- Why no response? The specific JavaScript library used for the file uploader has a conflict with the latest Android Chrome security patch. It works on desktop but fails on mobile.
- The Strategic Fix: The analyst files a “Critical” bug ticket. Engineering patches the library. Marketing pauses the Android ad spend until the fix is live.
- The Revenue Impact: The completion rate jumps to 18%. The CPL drops to profitable levels. The bank captures millions in loan value that was vanishing due to a technical glitch.
The Common Thread
In both cases, the “obvious” business answer was wrong.
- The retailer wanted to discount.
- The bank wanted to change the marketing targeting.
Those actions would have burned cash.
The actionable strategies came from digging past the surface. By connecting the business outcome (Returns, Drop-offs) to the operational reality (Size Guides, Code Bugs), the analytics team generated direct financial value.
This is the standard you must set for your team. Every insight must have a dollar sign attached to it.
V. Conclusion: Monetizing the Analyst
The transition from data reporting to insight generation is the most critical evolution for any analytics team. It changes the fundamental relationship between the data organization and the boardroom.
When you stop delivering observations and start delivering actionable insights, you stop being a cost center. You become a profit center.
This shift requires discipline. It demands that you refuse to accept “what happened” as a sufficient answer. You must relentlessly ask “why” until you find the root cause. You must apply frameworks like the 5 Whys to peel back the layers of your business performance. You must subject every finding to the criteria of novelty, relevance, and actionability.
If a chart does not help a stakeholder make a decision, it does not belong in the deck.
Organizations that master this process do not just make better decisions. They make faster decisions. They identify revenue leaks before they become floods. They spot market opportunities before their competitors do. They turn their data infrastructure into a tangible competitive advantage.
Your analytics investment should produce a return. It is time to demand more than just numbers on a screen.
Are you drowning in reports but starving for answers?
If your team struggles to bridge the gap between data collection and strategic decision-making, you may need an external perspective. Contact e-CENS today for a Strategic Analytics Audit. We help organizations transform their data capabilities to drive clear, revenue-generating actions.
Frequently Asked QuestionWhat is the difference between an observation and an actionable insight?
An observation is a passive statement of fact, such as “traffic dropped by 10%.” It describes the state of the world but offers no solution. An actionable insight combines that fact with context, causality, and a specific recommendation. For example, “Traffic dropped by 10% because of a broken checkout link on mobile; we must fix the code to recover lost revenue.” Observations state problems; insights define solutions.
What are the three criteria for a data insight to be considered actionable?
To determine if a finding is truly an insight, apply a three-part test. First, is it Novel? It must reveal a pattern the stakeholder did not already know. Second, is it Relevant? It must connect directly to a core business objective like revenue or risk. Third, is it Actionable? The business must have the ability to do something about it. If a finding fails any of these tests, it is just trivia, not an insight.
How do you use the “5 Whys” framework in digital analytics?
The “5 Whys” is an interrogation technique used to move from a surface-level symptom to a root cause. When a metric changes, you ask “Why?” five times in succession.
For example, if revenue drops (1), it might be because conversions dropped (2), which happened because the payment button failed (3), due to a JavaScript error (4), caused by a recent code deployment (5). This method prevents teams from applying band-aid fixes to deep technical or strategic problems.
How can analytics teams shift from a cost center to a profit center?
Analytics teams become profit centers when they stop focusing on reporting news and start focusing on protecting or generating revenue. This requires “closing the loop.” An analyst must identify a financial leak (e.g., high return rates due to bad sizing guides) or a growth opportunity (e.g., a high-converting audience segment) and recommend a specific fix. When the business executes that fix and revenue improves, the analytics team has generated a measurable return on investment.
Why do executives often ignore analytics dashboards?
Executives ignore dashboards when the data fails the “So What?” test. If a report contains pages of charts showing upward or downward trends but lacks a clear narrative explaining why those trends matter to the bottom line, it is viewed as noise. To fix this, reports should be structured around causality and recommendations, not just metric tracking. Every chart must force a decision.